Inspection
The inspection view focuses on a single aggregate. It rebuilds the aggregate from its events and shows you everything about it: the recorded events, the current state in several representations, and the snapshot if one exists. You can also time travel to see the aggregate as it looked at an earlier point in its history.
Opening an aggregate
The inspection index lets you pick an aggregate name and enter an id, then takes you to the detail page for that aggregate. You can also reach an aggregate from the store, where every row links straight into its inspection page.
If you only know the stream name, the bundle resolves it back to the matching aggregate. When a stream maps to exactly one aggregate, you land on its detail page directly. When it is ambiguous, you get a small selection screen first.
Tabs
The detail page shows the list of recorded events next to a set of tabs that each render the current state differently:
- Details: metadata about the aggregate, including its class, stream name and snapshot configuration.
- Serialized: the aggregate as it is persisted, produced with the hydrator. If the aggregate cannot be serialized, the error is shown instead.
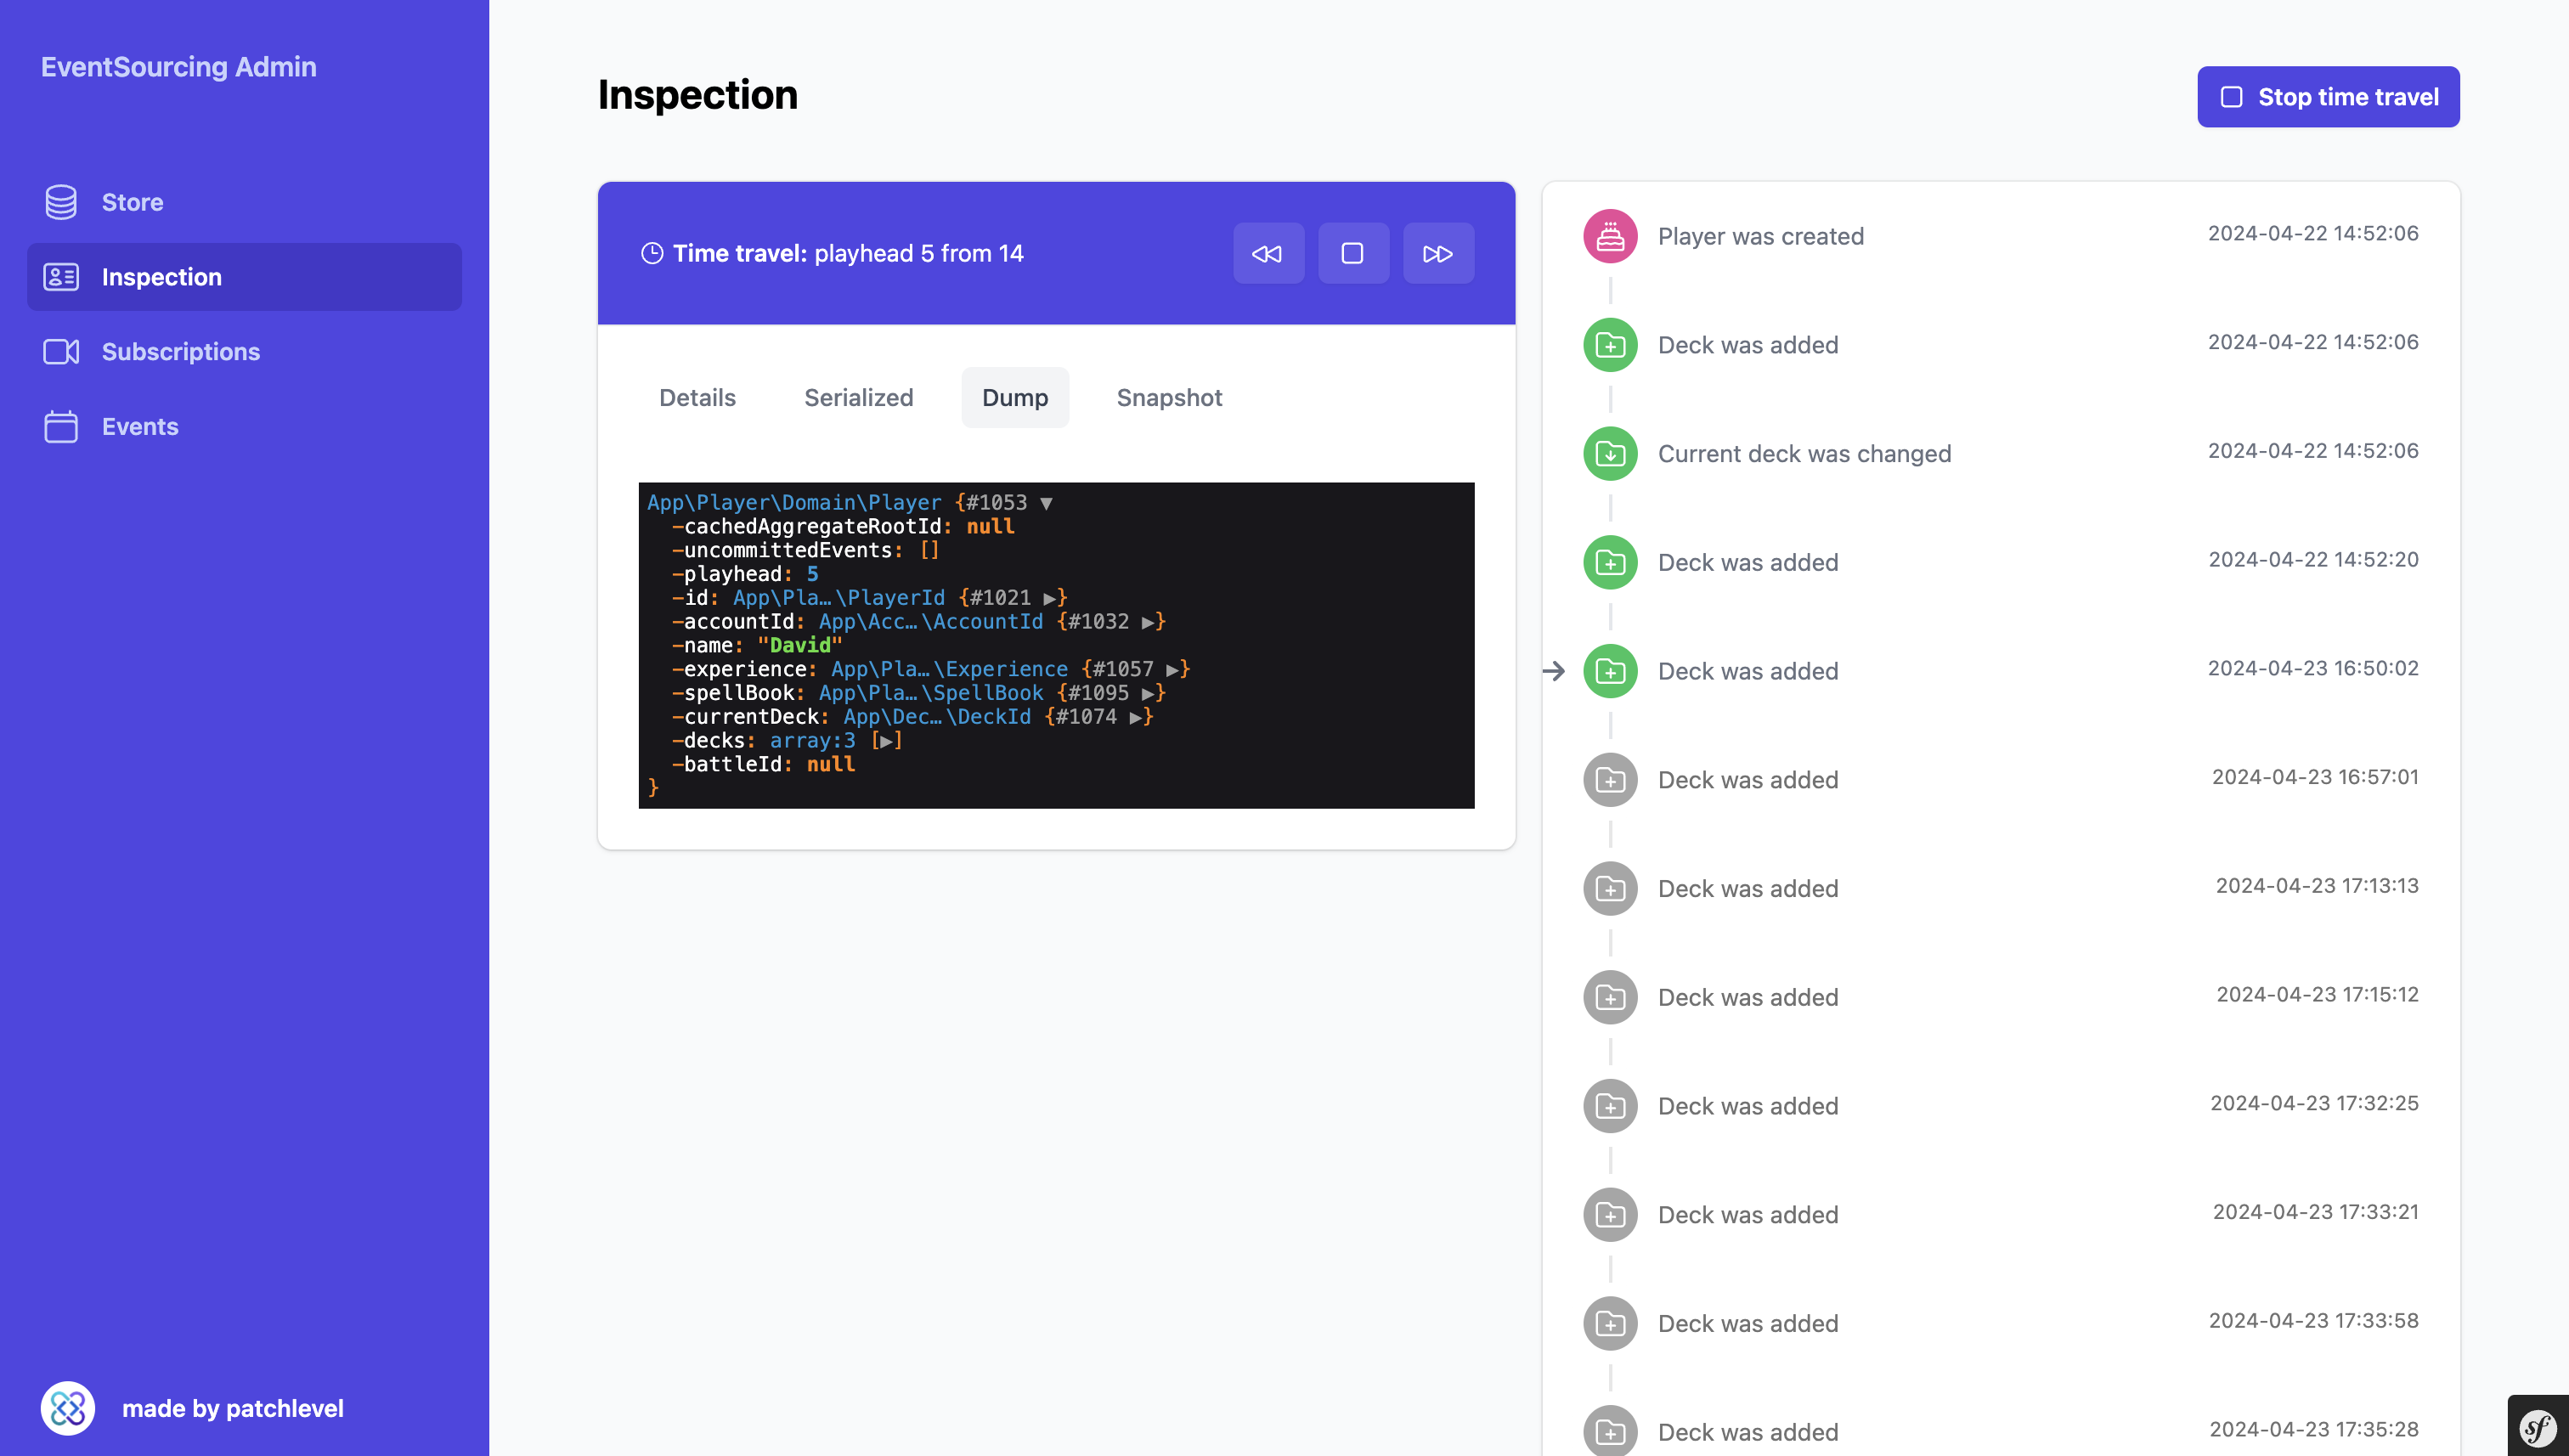
- Dump: a full
symfony/var-dumperdump of the live aggregate object, including private state. - Snapshot: the current snapshot loaded from the snapshot store, if snapshots are configured for this aggregate.
The serialized and snapshot tabs depend on your configuration. The serialized state needs an aggregate the hydrator can extract, and the snapshot tab needs a snapshot store that holds a snapshot for this aggregate.
Time travel
Every aggregate is rebuilt by replaying its events up to a given playhead. You can stop the replay at any event and see the state the aggregate had at that moment. In the UI you step forward and backward through the history, and every event in the list links to the state right after it was applied. This is useful to understand how a specific event changed the aggregate, or to debug an unexpected current state.
Combine time travel with the Dump tab to see the full internal state of the aggregate at each step, not just the serialized representation.