Dashboard
The dashboard view is the landing page of the bundle. It gives you an overview of your event sourcing setup at a glance, before you drill down into the store, a single aggregate or your subscriptions. The index route of the bundle redirects here.
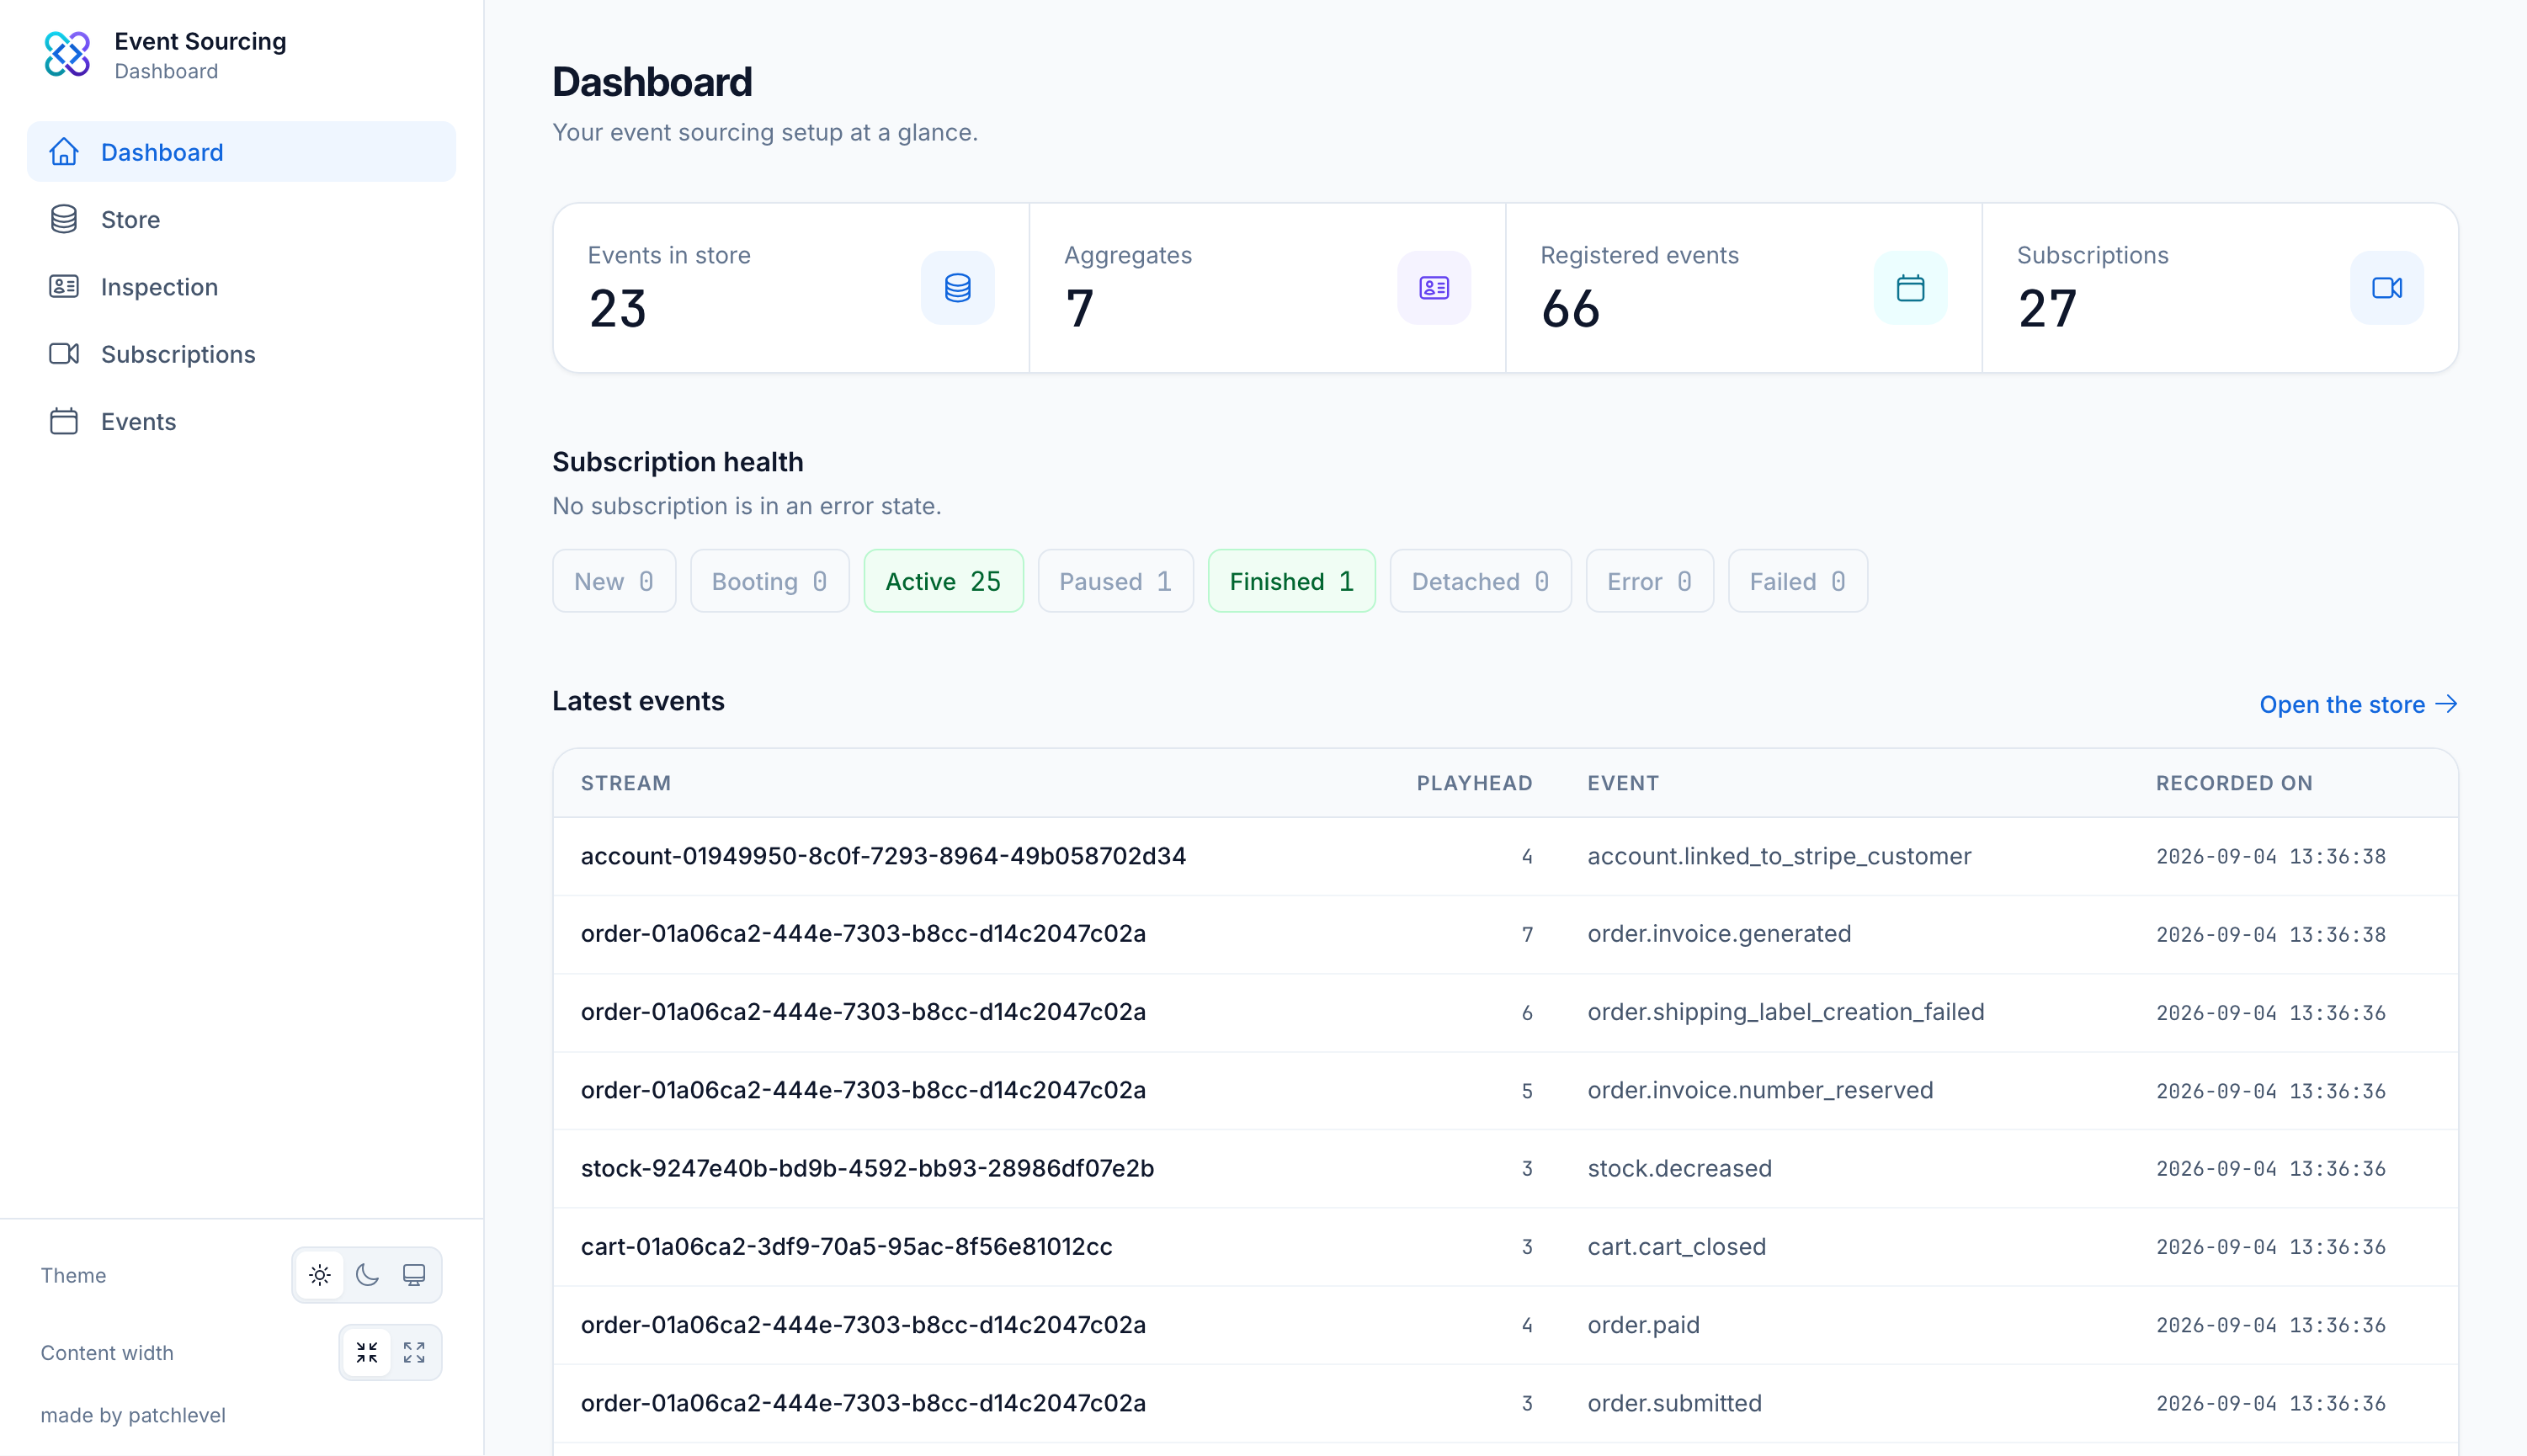
Overview
Four cards summarize the current state of your system:
- Events in store: how many messages your event store holds in total
- Aggregates: how many aggregate roots are registered
- Registered events: how many event classes are registered
- Subscriptions: how many subscriptions the subscription engine knows about
Each card links to the view where you can explore that number in detail.
Subscription health
Below the cards you see how your subscriptions are distributed across the statuses of the
subscription engine, for example active, booting, paused or error. Statuses without any
subscription are hidden, so in a healthy system you only see active.
Every status is a link into the subscriptions view, pre-filtered to that
status. This makes the dashboard a good starting point when something goes wrong: a red error
or failed pill takes you straight to the subscriptions that need attention.
If you only ever want to look at one thing, look at this row. Everything else on the page is
informational, but a non-empty error or failed count means events are not being processed.
Latest events
The last recorded events are listed at the bottom, newest first, with the same columns as the store view. From here you can jump into the inspection of the aggregate or stream that recorded an event, or open the full store listing.